The figure below shows the cost and revenue curves faced by a profit-maximizing monopolist. _____ on the figure represents the deadweight loss of monopoly.
Figure 9.10
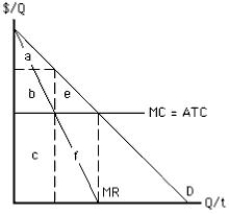
A) Area a
B) Area b
C) Area c
D) Area f
E) Area e
Correct Answer:
Verified
Q128: The true deadweight loss created by a
Q129: The figure given below depicts the cost
Q130: Empirical estimates indicate that the annual deadweight
Q131: The figure below shows the cost and
Q134: The figure below shows the cost and
Q135: The figure below shows the cost and
Q138: If the government breaks up a monopoly
Q142: The actual deadweight loss from monopoly in
Q147: A major fruit juice manufacturer fails in
Q151: The practice of charging different prices to
Unlock this Answer For Free Now!
View this answer and more for free by performing one of the following actions

Scan the QR code to install the App and get 2 free unlocks

Unlock quizzes for free by uploading documents