Figure 10.4 shows the demand, marginal revenue, and cost curves for a monopolistic competitor. At the profit-maximizing output level, the total cost incurred by the firm in is approximately _____.
Figure 10.4
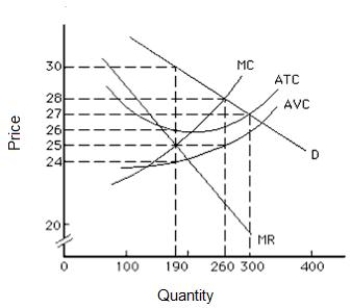
A) $5,700
B) $5,320
C) $4,750
D) $4,940
E) $8,100
Correct Answer:
Verified
Q22: A monopolistically competitive firm is producing at
Q38: In the short run,a monopolistically competitive firm
Q42: In both monopolistic competition and a non-price-discriminating
Q71: Which of the following characteristics do firms
Q74: Figure 10.3 shows the demand, marginal revenue,
Q74: Which of the following is true of
Q77: One difference between perfect competition and monopolistic
Q78: Suppose a monopolistically competitive firm is in
Q80: In the long run, a monopolistically competitive
Q84: Figure 10.4 shows the demand, marginal revenue,
Unlock this Answer For Free Now!
View this answer and more for free by performing one of the following actions

Scan the QR code to install the App and get 2 free unlocks

Unlock quizzes for free by uploading documents