The following graph shows the demand and supply curves of a resource. Which unit of the resource is earning the highest economic rent? Figure 11.2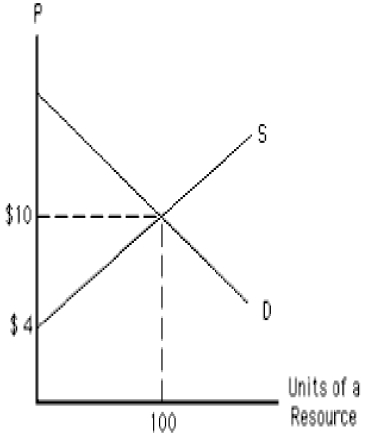
A) The first unit
B) The tenth unit
C) The fifteenth unit
D) The hundredth unit
E) The fifth unit
Correct Answer:
Verified
Q67: The following graph shows the demand and
Q68: The following graph shows the demand and
Q69: The following graph shows the labor market.
Q70: The following graph shows the demand and
Q71: The following graph shows the labor market.
Q73: The following graph shows the demand and
Q74: The following graph shows the labor market.
Q75: The following graph shows the labor market.
Q76: The following graph shows the demand and
Q77: The following graph shows the labor market.
Unlock this Answer For Free Now!
View this answer and more for free by performing one of the following actions

Scan the QR code to install the App and get 2 free unlocks

Unlock quizzes for free by uploading documents