The following graph shows the demand and supply curves of a resource. The equilibrium quantity of the resource exchanged in the market is _____. Figure 11.3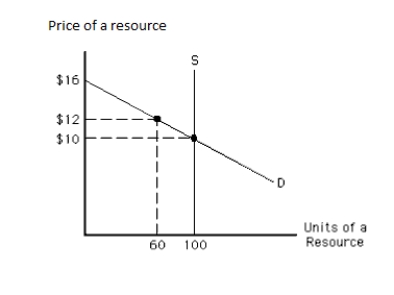
A) more than 100 units
B) 100 units
C) 60 units
D) less than 60 units
E) more than 60 units but less than 100 units
Correct Answer:
Verified
Q48: The greater the economic rent as a
Q49: Permanent differentials in resource prices will cause
Q61: The following graph shows the labor market.
Q62: The following graph shows the labor market.
Q63: The following graph shows the labor market.
Q65: The following graph shows the labor market.
Q66: The following graph shows the labor market.
Q67: The following graph shows the demand and
Q68: The following graph shows the demand and
Q69: The following graph shows the labor market.
Unlock this Answer For Free Now!
View this answer and more for free by performing one of the following actions

Scan the QR code to install the App and get 2 free unlocks

Unlock quizzes for free by uploading documents