The following graph shows the demand and supply curves of a resource. The equilibrium price of the resource is _____. Figure 11.4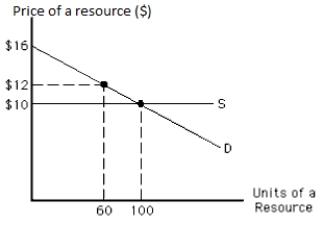
A) $16
B) $12
C) $10
D) less than $10
E) between $16 and $10
Correct Answer:
Verified
Q81: The more elastic the supply of a
Q86: Economic rent is _
A)the opportunity cost of
Q94: The following graph shows the demand and
Q95: The following graph shows the demand and
Q98: The following graph shows the demand and
Q99: The following graph shows the demand and
Q100: The following graph shows the demand and
Q101: Suppose 2 froyo machines and 12 workers
Q102: The following table shows data for a
Q107: A resource's marginal product is
A)the revenue produced
Unlock this Answer For Free Now!
View this answer and more for free by performing one of the following actions

Scan the QR code to install the App and get 2 free unlocks

Unlock quizzes for free by uploading documents