The following graph shows the demand and supply curves of a resource. The economic rent of the resource in equilibrium is represented by the area _____. Figure 11.5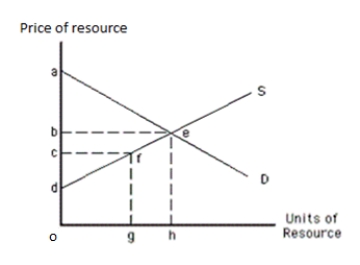
A) abe
B) befc
C) gfeh
D) cdf
E) bed
Correct Answer:
Verified
Q78: The following graph shows the demand and
Q79: The following graph shows the demand and
Q80: The following graph shows the demand and
Q82: The following graph shows the demand and
Q84: The following graph shows the demand and
Q85: Which of the following resources earns the
Q87: If a firm is experiencing diminishing marginal
Q94: A game show host who gave up
Q111: Suppose 15 workers produce 100 license plates,16
Q117: If the supply of a resource is
Unlock this Answer For Free Now!
View this answer and more for free by performing one of the following actions

Scan the QR code to install the App and get 2 free unlocks

Unlock quizzes for free by uploading documents