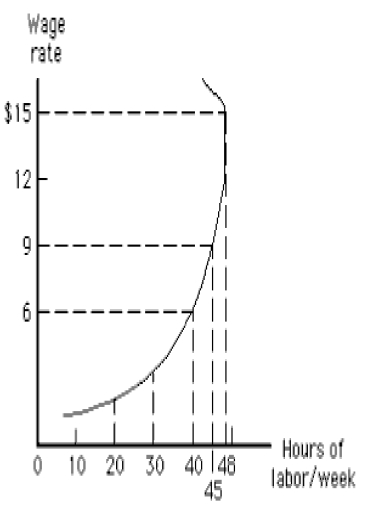
The figure given below shows a backward-bending labor supply curve for an individual. In the figure below, when the wage rate rises above $12, the substitution effect outweighs the income effect.
Figure 12.5
Correct Answer:
Verified
Q5: The figure given below shows a backward-bending
Q11: A consumer maximizes utility by allocating time
Q16: As the wage rate increases, the income
Q18: Jason can maximize his satisfaction by allocating
Q21: As the wage rate increases, the substitution
Q27: The demand for labor curve bends backward
Q87: An increase in the wage rate will
Q112: Most labor negotiations in the United States
Q162: Every individual has a labor supply curve
Q196: The unions of plumbers and carpenters are
Unlock this Answer For Free Now!
View this answer and more for free by performing one of the following actions

Scan the QR code to install the App and get 2 free unlocks

Unlock quizzes for free by uploading documents