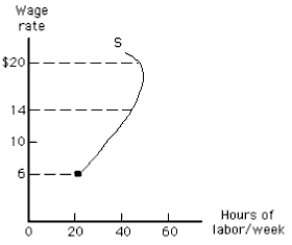
The figure given below shows a backward-bending labor supply curve for an individual. In the figure below, which of the following is true if the wage rate decreases from $14 to $6 per hour?
Figure 12.2
A) The income effect dominates the substitution effect.
B) The substitution effect dominates the income effect.
C) No labor is supplied.
D) The income effect equals the substitution effect.
E) The supply curve is horizontal.
Correct Answer:
Verified
Q11: People who are more productive in nonmarket
Q48: Along a backward-bending labor supply curve, the
A)income
Q59: If nonmarket work is a normal good,
Q62: The figure given below shows a backward-bending
Q63: Which of the following statements would be
Q65: The figure given below shows a backward-bending
Q66: A person who wins a large sum
Q67: The average work week in the United
Q68: The figure given below shows a backward-bending
Q69: The figure given below shows a backward-bending
Unlock this Answer For Free Now!
View this answer and more for free by performing one of the following actions

Scan the QR code to install the App and get 2 free unlocks

Unlock quizzes for free by uploading documents