The following figure shows the long-run average cost curve for a tire manufacturer and the long run average cost curve for a rubber producer. Which of the following can be concluded from the information provided in the figure given below?
Figure 14.1
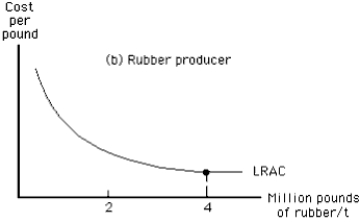
A) The cost of producing rubber is much lower than the cost of producing tires.
B) The total cost of producing 100,000 tires is greater than the total cost of producing 200,000 tires.
C) The minimum efficient scale of producing rubber is 4 million pounds.
D) The minimum efficient scale of producing tires is greater than 200,000 tires.
E) The marginal cost of producing the 200,000th tire must exceed the average cost of 200,000 tires.
Correct Answer:
Verified
Q23: In order to organize and carry out
Q51: Consumers generally consider the process of learning
Q54: A firm that produces mouthwash branches out
Q59: When a multiproduct firm like General Electric
Q70: Apple Computers is more likely to continue
Q73: An ideal example of a vertically integrated
Q76: Which of the following is likely to
Q77: Which of the following is an example
Q79: One reason a computer manufacturer may make
Q80: The following figure shows the long-run average
Unlock this Answer For Free Now!
View this answer and more for free by performing one of the following actions

Scan the QR code to install the App and get 2 free unlocks

Unlock quizzes for free by uploading documents