The following figure shows the long-run average cost curve for a tire manufacturer and the long-run average cost curve for a rubber producer. Which of the following is indicated by the figure given below?
Figure 14.1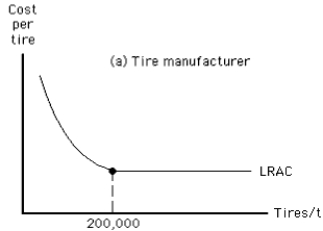
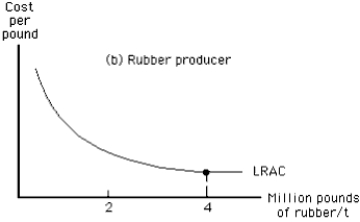
A) The cost of producing rubber is much lower than the cost of producing tires.
B) The total cost of producing 100,000 tires is greater than the total cost of producing 200,000 tires.
C) The minimum efficient scale of producing tires is 200,000 tires.
D) The minimum efficient scale of producing tires is greater than 200,000 tires.
E) The marginal cost of producing the 200,000th tire must exceed the average cost of 200,000 tires.
Correct Answer:
Verified
Q46: Most consumers consider the process of gathering
Q47: If a firm experiences economies of scope,_
A)its
Q49: Which of the following is the best
Q60: If the minimum efficient scale in microwave
Q61: One reason many people make their own
Q62: If the quality of an input is
Q66: A company that produces furniture wax branches
Q67: Reliable information is:
A)costly for consumers, but not
Q68: Promotional brochures of various products, computer publications,
Q70: Apple Computers is more likely to continue
Unlock this Answer For Free Now!
View this answer and more for free by performing one of the following actions

Scan the QR code to install the App and get 2 free unlocks

Unlock quizzes for free by uploading documents