The figure given below shows the marginal cost and the marginal benefit of information curves. In the figure given below, the point I1 indicates: Figure 14.2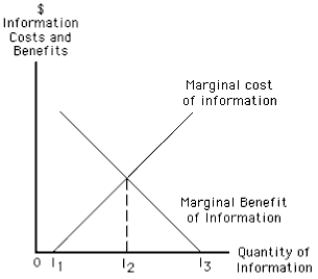
A) the optimal amount of information gathered.
B) common knowledge.
C) the opportunity cost of a consumer's time.
D) adverse selection.
E) that all information is costly.
Correct Answer:
Verified
Q61: According to Stigler's search model,we should expect
Q73: The marginal benefit of acquiring additional information
Q80: Which of the following is true of
Q95: Publications such as Consumer Reports :
A)increase the
Q96: For which of the following goods is
Q97: The figure given below shows the marginal
Q101: Imperfect information among the potential bidders of
Q103: One result of asymmetric information in the
Q103: Individuals who have a tendency to default
Q105: The timeshare condominium in Florida bought by
Unlock this Answer For Free Now!
View this answer and more for free by performing one of the following actions

Scan the QR code to install the App and get 2 free unlocks

Unlock quizzes for free by uploading documents