Figure 15.2 shows the cost and revenue curves for a monopolist. The increase in consumer surplus when price is set equal to marginal cost rather than at the profit-maximizing level is shown by area _____.
Figure 15.2
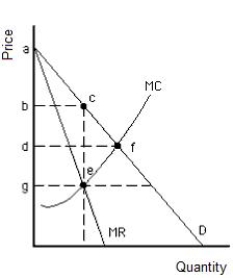
A) abc
B) adf
C) cef
D) dfeg
E) bcfd
Correct Answer:
Verified
Q16: A natural monopoly,such as a local telephone
Q23: Which of the following is a possible
Q28: In order to maximize profit,an unregulated monopolist
Q33: Watt Power and Light,an electric company,is an
Q38: Most local phone companies _
A)face a vertical
Q42: Suppose the local government is considering using
Q45: If a firm has a downward-sloping long-run
Q47: Figure 15.2 shows the cost and revenue
Q49: If a regulator sets the price in
Q51: In which of the following ways can
Unlock this Answer For Free Now!
View this answer and more for free by performing one of the following actions

Scan the QR code to install the App and get 2 free unlocks

Unlock quizzes for free by uploading documents