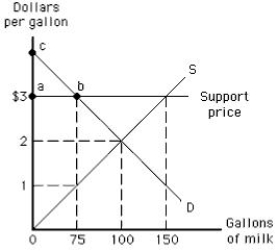
The following graph shows the market for milk. Suppose the government introduces a variety of policies that set floor prices for milk at $3. Considering government expenditures on surplus milk but ignoring storage costs, the consumers pay _____ per gallon for the quantity purchased at the support price.
Figure 16.1
A) $3.00
B) $4.00
C) $5.00
D) $1.00
E) $2.00
Correct Answer:
Verified
Q21: An example of competing-interest legislation is
A)a quota
Q69: When the government increases taxes to provide
Q70: Environmentalists, worried about sulfur dioxide in the
Q71: Legislation that provides a price support for
Q74: JPC Motors benefits from tariffs on imported
Q76: The following graph shows the market for
Q78: With special-interest legislation, _.
A)benefits are concentrated but
Q79: If general tax revenues were used to
Q82: Legislators often have difficulty passing legislation with
Q90: When the support price for milk and
Unlock this Answer For Free Now!
View this answer and more for free by performing one of the following actions

Scan the QR code to install the App and get 2 free unlocks

Unlock quizzes for free by uploading documents