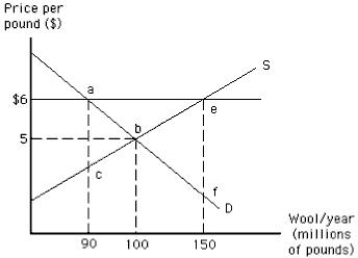
The following graph shows the market for wool. Suppose the government introduces a variety of policies that set floor prices for wool at $6. As a result of the price support, the typical consumer-taxpayer in effect pays _____for each pound of wool actually purchased.
Figure 16.2
A) $6
B) $5
C) $12
D) $11
E) $1
Correct Answer:
Verified
Q63: Competing-interest legislation:
A)imposes benefits on only a few
Q64: Legislation that provides a subsidies for tobacco
Q66: It is not likely that farm price
Q68: Competing-interest legislation is characterized by:
A)a quota
Q69: Special-interest legislation that imposes costs over many
Q69: When the government increases taxes to provide
Q70: Environmentalists, worried about sulfur dioxide in the
Q71: Legislation that provides a price support for
Q83: The government of Marina sets floor prices
Q90: When the support price for milk and
Unlock this Answer For Free Now!
View this answer and more for free by performing one of the following actions

Scan the QR code to install the App and get 2 free unlocks

Unlock quizzes for free by uploading documents