The following graph shows market equilibrium in the presence of an externality. The total social gain from producing the socially efficient output is:
Figure 17.2
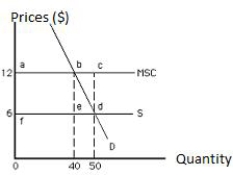
A) $60.
B) $30.
C) $6.
D) $480.
E) $300.
Correct Answer:
Verified
Q27: The deforestation of rainforests due to human
Q32: Open-access resources tend to be _
A)conserved.
B)taxed.
C)overused.
D)efficiently used.
E)underutilized.
Q38: The depletion of rainforests due to human
Q39: Which of the following is true of
Q42: Byproducts of production or consumption that impose
Q44: The following graph shows equilibrium in a
Q46: Fish in the sea can be harvested
Q50: To solve the common-pool problem in fishing,
Q51: The following graph shows equilibrium in a
Q52: Which of the following is not an
Unlock this Answer For Free Now!
View this answer and more for free by performing one of the following actions

Scan the QR code to install the App and get 2 free unlocks

Unlock quizzes for free by uploading documents