The following graph shows the market for pollution rights. The supply curve represents the amount of ______.
Figure 17.4
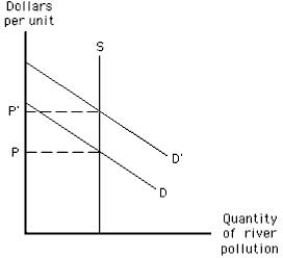
A) toxins the firms want to dump into the river
B) water that can be used as an input by firms
C) toxins that can be dumped into the river without reducing the water quality below a certain level
D) pollution the firm is willing to clean up
E) the pollution-causing good supplied by the industry
Correct Answer:
Verified
Q110: The Superfund law was designed to clean
Q112: The following graph shows the optimal allocation
Q113: The government passes a new law allowing
Q114: Untreated raw sewage in the U.S. is
Q118: Which of the following would happen if
Q124: Control of water pollution from pesticide runoff
Q129: Suppose environmental groups pressure the local government
Q130: The Clean Air Act of 1970 _
A)set
Q131: The Clean Air Act of 1970 has
Q133: Dumping raw sewage into Boston Harbor is
Unlock this Answer For Free Now!
View this answer and more for free by performing one of the following actions

Scan the QR code to install the App and get 2 free unlocks

Unlock quizzes for free by uploading documents