The following graph shows the optimal allocation of pollution rights to firms polluting a river. If the government sells the right to pollute a river, _____.
Figure 17.5
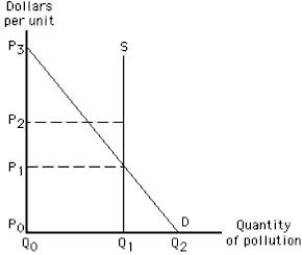
A) firms will emit Q1 units of the pollutant at a price of P0 each
B) firms will emit Q2 units of the pollutant at a price of P0 each
C) firms will emit Q0 units of the pollutant at a price of P3 each
D) firms will emit Q1 units of the pollutant at a price of P1 each
E) firms will emit Q2 units of the pollutant at a price of P3 each
Correct Answer:
Verified
Q103: Markets for pollution rights _
A)assign property rights
Q113: If producers cannot afford the fees for
Q116: Nearly half of the Superfund has been
Q117: The price of a pollution right is
Q123: Which of the following helps explain why
Q124: _ are usually recycled in the United
Q147: When the benefits to society of using
Q151: In order to increase society's well-being,education should
Q160: If the benefits to society of students
Q176: If farmers decide individually whether or not
Unlock this Answer For Free Now!
View this answer and more for free by performing one of the following actions

Scan the QR code to install the App and get 2 free unlocks

Unlock quizzes for free by uploading documents