The following graph shows the demand, the supply, and the marginal social benefit curves. The graph shows market equilibrium in the presence of ______.
Figure 17.6
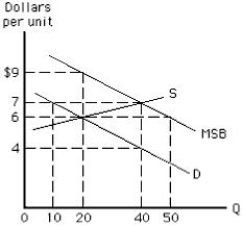
A) positive externalities
B) positive and negative externalities
C) negative externalities
D) the Coase theorem
E) asymmetric information
Correct Answer:
Verified
Q125: The main objective of the Comprehensive Environmental
Q140: Which of the following accounts for the
Q141: If the quantity of smallpox vaccinations is
Q142: The following graph shows the demand, the
Q144: Which of the following responses to a
Q145: The following graph shows the demand, the
Q145: To enhance social welfare,the government should encourage
Q149: In order to increase society's well-being,measles vaccinations
Q155: Unpriced byproducts of production or consumption that
Q157: Education confers positive externalities because _
A)some education
Unlock this Answer For Free Now!
View this answer and more for free by performing one of the following actions

Scan the QR code to install the App and get 2 free unlocks

Unlock quizzes for free by uploading documents