The following cost graphs illustrate various types of cost behaviors. 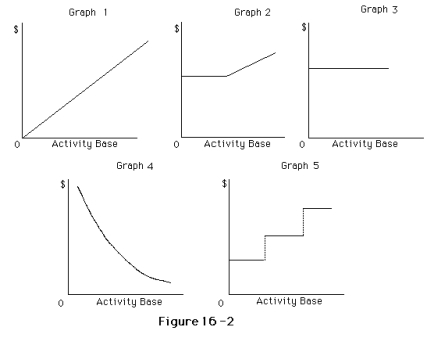
For each of the following costs,identify the cost graph that best describes its cost behavior as the number of units produced and sold increases.

Correct Answer:
Verified
Q117: If variable costs per unit decreased because
Q118: Kennedy Co.sells two products,Arks and Bins.Last year,Kennedy
Q121: Cost-volume-profit analysis CANNOT be used if which
Q124: If sales are $300,000,variable costs are 60%
Q126: For the current year ending January 31,Ringo
Q127: With the aid of computer software, managers
Q127: For the coming year,Belton Company estimates fixed
Q137: Which of the following conditions would cause
Q146: When a business sells more than one
Q148: The relative distribution of sales among the
Unlock this Answer For Free Now!
View this answer and more for free by performing one of the following actions

Scan the QR code to install the App and get 2 free unlocks

Unlock quizzes for free by uploading documents