Given the following graphs, which graph represents fixed costs? 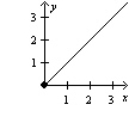
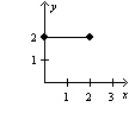
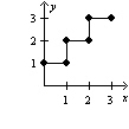

A) I
B) II
C) III
D) none of these
Correct Answer:
Verified
Q16: As the volume of activity increases within
Q41: The _ method is used whenever least
Q66: Drivers that explain changes in costs as
Q70: Fixed cost per unit is $7 when
Q73: The drivers that explain changes in costs
Q74: In a traditional cost management system, cost
Q75: Which of the following would be an
Q77: Cumulative average-time _ curve assumes the cumulative
Q78: The range of activity within which a
Q80: When the volume of activity increases within
Unlock this Answer For Free Now!
View this answer and more for free by performing one of the following actions

Scan the QR code to install the App and get 2 free unlocks

Unlock quizzes for free by uploading documents