The following diagram is a cost-volume-profit graph for a manufacturing company: 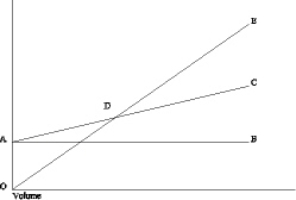 The difference between line AB and line AC (area BAC) is the
A) contribution ratio.
B) total variable cost.
C) contribution margin per unit.
D) total fixed cost.
Correct Answer:
Verified
Q18: Product 1 has a contribution margin of
Q21: On a profit-volume graph, the intersection of
Q24: In a cost-volume-profit graph,
A) the total revenue
Q25: Using cost-volume-profit analysis, we can conclude that
Q27: In a cost-volume-profit graph, the slope of
Q92: Assuming all other things are the same,
Q101: The DesMaris Company had the following income
Q102: The income statement for Symbiosis Manufacturing Company
Q114: A very high degree of operating leverage
Q118: Nonesuch Company sells only one product at
Unlock this Answer For Free Now!
View this answer and more for free by performing one of the following actions

Scan the QR code to install the App and get 2 free unlocks

Unlock quizzes for free by uploading documents