Multiple Choice
Infographic 6.1.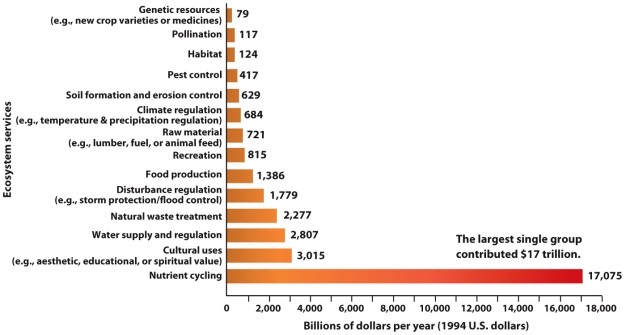
-Refer to Infographic 6.1. What does the figure show?
A) the cost to restore a degraded ecosystem for particular ecosystem services
B) the price of maintaining ecosystems such that they can continue to provide specific ecosystem services without degrading the environment
C) the monetary value ascribed to particular ecosystem services
D) the ecological footprint value of specific ecosystem services
E) the cost differential between natural capital and natural interest
Correct Answer:
Verified
Related Questions

