Infographic 29.1.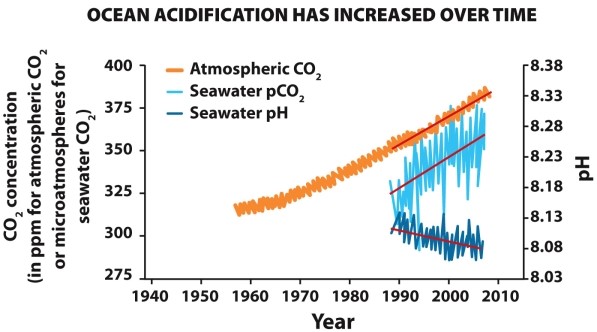
-Refer to the graph depicting ocean acidification over time in Infographic 29.1. As the atmospheric concentration of CO₂ increases, the amount of CO₂ absorbed by the oceans (pCO₂) also increases. This type of relationship is _________.
A) directly proportional
B) inversely proportional
C) negative feedback
D) positive feedback
E) None of these answers are correct.
Correct Answer:
Verified
Q2: Which factor in the ocean is key
Q3: The deepest zone in the ocean is
Q4: What is the major cause of ocean
Q6: By some estimates, 30% of all the
Q7: A small change of 0.1 in pH
Q8: What is ocean acidification? How are humans
Q8: "Less plankton leads to less carbon dioxide
Unlock this Answer For Free Now!
View this answer and more for free by performing one of the following actions

Scan the QR code to install the App and get 2 free unlocks

Unlock quizzes for free by uploading documents