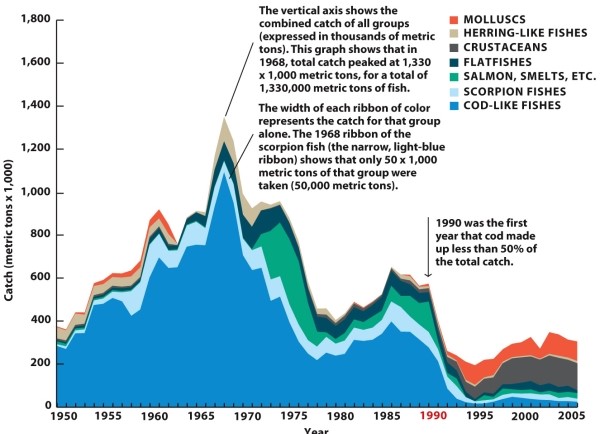
-Refer to Infographic 31.4. The figure shows fish catches in the Newfoundland-Labrador Shelf area of the North Atlantic. Describe the shift in the species and amounts taken in 1968, 1990, and 2005.
Correct Answer:
Verified
View Answer
Unlock this answer now
Get Access to more Verified Answers free of charge
Q5: In Frenchman Bay,Maine,the objective of David Alves'
Q21: The difference between a marine-protected area and
Q22: Infographic 31.1. Q23: Infographic 31.3. Q24: The Marine Trophic Index has decreased dramatically Q26: The Magnuson-Stevens Fishery Conservation and Management Act Q27: The Marine Stewardship Council defines a sustainable Q29: One of the major problems of managing Q30: As a marine biologist, you notice that Q33: Many nations have tried to protect their![]()
![]()
Unlock this Answer For Free Now!
View this answer and more for free by performing one of the following actions

Scan the QR code to install the App and get 2 free unlocks

Unlock quizzes for free by uploading documents