Using Figure 1.4,which of the following statements are accurate? 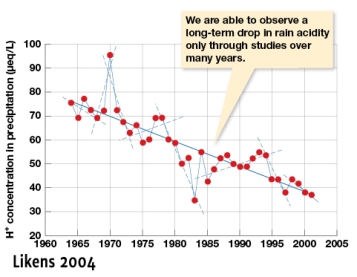
A) The overall trend shows a negative effect of time on hydrogen ion concentration in precipitation
B) From 1965 to 1975 the trend is flat
C) From 1965 to 1975 the trend is a decline in hydrogen ion concentration
D) The data need to be looked at year by year and not over this long a period
Correct Answer:
Verified
Q20: A researcher is studying how individual single-celled
Q21: Ecologists may use which of these approaches
Q22: Variation in your data affects the standard
Q23: An experiment you have been conducting uses
Q24: Ecological phenomena occur at a variety of
Q26: If an ecologist studies interbreeding between populations
Q27: A manipulative field experiment was conducted to
Q28: Generally,most studies will evaluate a hypothesis based
Q29: You are interested in finding out why
Q30: In the case of the Hubbard Brook
Unlock this Answer For Free Now!
View this answer and more for free by performing one of the following actions

Scan the QR code to install the App and get 2 free unlocks

Unlock quizzes for free by uploading documents