Figure 14.2 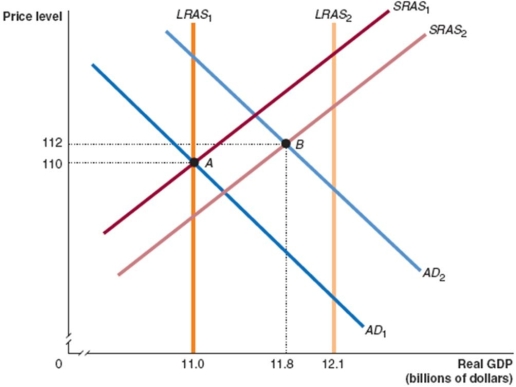
-In Figure 14.2,given the economy is at point A in year 1 and point B in year 2,what is the growth rate in real GDP between those two years?
A) 2.5 per cent
B) 7.3 per cent
C) 8.0 per cent
D) 10.0 per cent
Correct Answer:
Verified
Q81: Starting from long-run equilibrium, use the basic
Q94: Beginning at long-run equilibrium, (i)use the basic
Q96: What is the relationship among the AD,
Q107: In the dynamic aggregate demand and aggregate
Q114: In the dynamic aggregate demand and aggregate
Q123: The basic (static)aggregate demand and aggregate supply
Unlock this Answer For Free Now!
View this answer and more for free by performing one of the following actions

Scan the QR code to install the App and get 2 free unlocks

Unlock quizzes for free by uploading documents