Figure 12.1 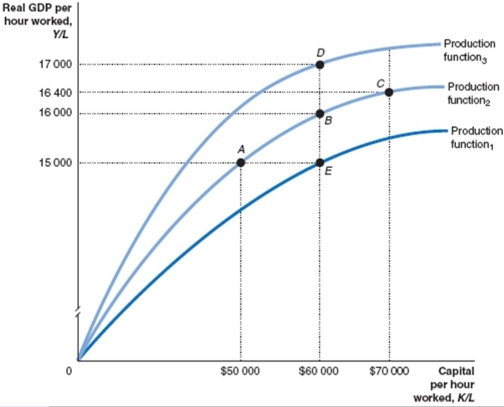
-The movement from A to E in Figure 12.1 illustrates
A) negative technological change.
B) a decline in capital per worker.
C) zero returns to capital.
D) diminishing returns to labour.
Correct Answer:
Verified
Q5: When the capital stock per hour worked:
A)increases,
Q23: Which of the following will result in
Q23: An increase in _ shifts _ the
Q79: Use the rule of 70 to illustrate
Q90: If the per-worker production function shifts up
A)it
Q158: Outline the trend in real GDP per
Q161: Figure 12.1 Q164: Figure 12.1 Q165: If there is a change in the Q167: Figure 12.1 Unlock this Answer For Free Now! View this answer and more for free by performing one of the following actions Scan the QR code to install the App and get 2 free unlocks Unlock quizzes for free by uploading documents![]()
![]()
![]()

