Figure 11.1 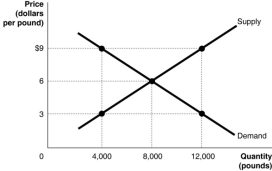
-Refer to Figure 11.1.The figure above represents the market for pecans.Assume that this is a competitive market.If the price of pecans is $3,
A) economic surplus is maximised.
B) not enough consumers want to buy pecans.
C) the quantity supplied is less than the economically efficient quantity.
D) the quantity supplied is economically efficient, but the quantity demanded is economically inefficient.
Correct Answer:
Verified
Q2: Figure 11.1 Q4: Figure 11.1 Q6: Figure 11.1 Q6: How can the market demand for a Q8: Which of the following displays these two Unlock this Answer For Free Now! View this answer and more for free by performing one of the following actions Scan the QR code to install the App and get 2 free unlocks Unlock quizzes for free by uploading documents![]()
![]()
![]()

