Figure 11-7 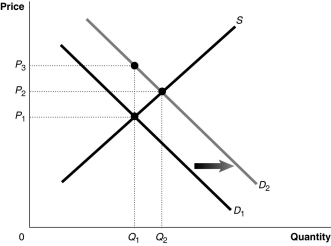 Figure 11-7 shows a market with an externality. The current market equilibrium output of Q1 is not the economically efficient output. The economically efficient output is Q2.
-Refer to Figure 11-7.Suppose the current market equilibrium output of Q1 is not the economically efficient output because of an externality.The economically efficient output is Q2.In that case,diagram shows
A) the effect of a subsidy granted to producers of a good.
B) the effect of excess demand in a market.
C) the effect of a positive externality on the consumption of a good.
D) the effect of a negative externality on the consumption of a good.
Correct Answer:
Verified
Q21: A market supply curve reflects the
A)external costs
Q34: Which of the following would result in
Q35: A positive externality results when
A)economists are sure
Q44: The cost borne by a producer in
Q50: If the social cost of producing a
Q52: When production generates a negative externality, the
Q57: If there are no externalities, a competitive

