Multiple Choice
Figure 11-8 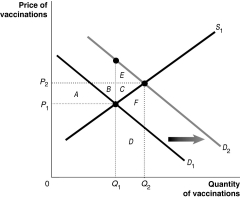 Figure 11-8 shows the market for measles vaccinations, a product whose use generates positive externalities.
-Refer to Figure 11-8.What does D2 represent?
A) The social welfare curve.
B) The demand curve reflecting social benefit.
C) The demand curve reflecting private benefit.
D) The positive externalities curve.
Correct Answer:
Verified
Related Questions

