Figure 10-3 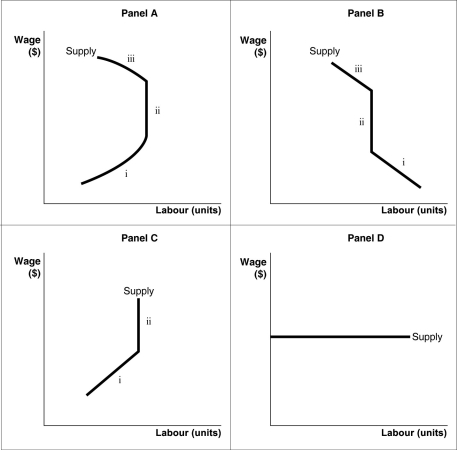
-Refer to Figure 10-3.Which of the panels in the diagram best represents an individual's labour supply curve?
A) Panel A
B) Panel B
C) Panel C
D) Panel D
Correct Answer:
Verified
Q62: A firm's labour demand curve is also
Q81: The income effect of a wage increase
Q84: Figure 10.3 Q85: The substitution effect of a wage increase Q85: Figure 10.3 Q86: An individual's labour supply curve shows Q91: Explain how the market for opticians is Q93: The combined effect (both income and substitution) Q96: How will an increase in population affect Q99: Figure 10-4 Unlock this Answer For Free Now! View this answer and more for free by performing one of the following actions Scan the QR code to install the App and get 2 free unlocks Unlock quizzes for free by uploading documents![]()
![]()
A) the![]()

