Multiple Choice
Figure 9-4 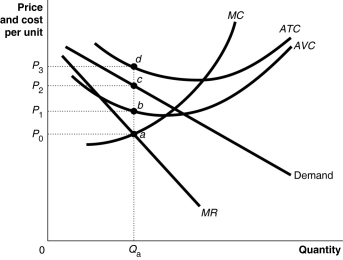 Figure 9-4 shows short-run cost and demand curves for a monopolistically competitive firm in the market for designer watches.
-Refer to Figure 9-4.What is the area that represents the loss made by the firm?
A) The area P0adP3
B) The area P1bcP2
C) The area P0acP2
D) The area P2cdP3
Correct Answer:
Verified
Related Questions
Q64: Figure 9-4 Q65: If price exceeds average variable cost but Q66: Suppose Jason owns a small pastry shop.Jason![]()

