Figure 9-11 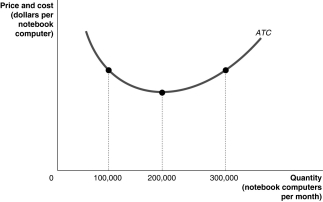
-Refer to Figure 9-11.Suppose the graph represents the relationship between the average total cost of producing notebook computers and the quantity of notebook computers produced by Dell.On a graph,illustrate the demand,MR,MC,and ATC curves which would represent Dell maximising profits at a quantity of 100 000 per month and identify the area on the graph which represents the profit.
Correct Answer:
Verified
Q87: Figure 9.8 Q104: In the long run,what happens to the Q104: A monopolistically competitive firm should lower its Q105: Unlike a perfectly competitive firm, a monopolistic Q106: Assume that price exceeds average variable cost Q112: Consumers in a monopolistically competitive market do Q119: A monopolistically competitive industry that earns economic Q119: If a perfectly competitive firm maximises short-run Q134: You are planning to open a new Q136: A monopolistically competitive firm that is earning![]()
Unlock this Answer For Free Now!
View this answer and more for free by performing one of the following actions

Scan the QR code to install the App and get 2 free unlocks

Unlock quizzes for free by uploading documents