Multiple Choice
Figure 8-2 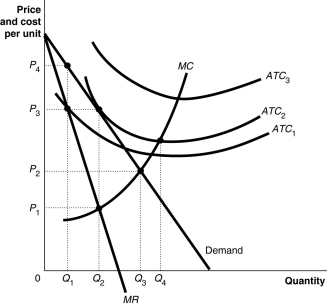 Figure 8-2 above shows the demand and cost curves facing a monopolist.
-Refer to Figure 8-2.To maximise profit,the firm will produce
A) Q1.
B) Q2.
C) Q3.
D) Q4.
Correct Answer:
Verified
Related Questions
Q64: Figure 8-2 ![]()

