Multiple Choice
Figure 8-4 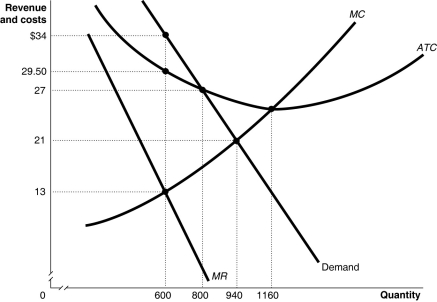 Figure 8-4 shows the demand and cost curves for a monopolist.
-Refer to Figure 8-4.What is the amount of the monopoly's total revenue?
A) $21 600
B) $20 400
C) $19 740
D) $7800
Correct Answer:
Verified
Related Questions

