Figure 8-6 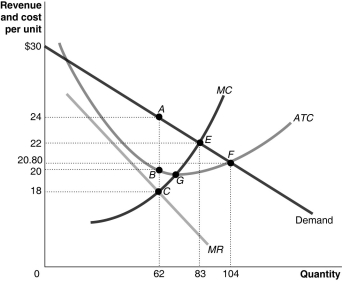 Figure 8-6 shows the cost and demand curves for a monopolist.
-Refer to Figure 8-6.The monopolist's total revenue is
A) $1116.
B) $1488.
C) $1726.40.
D) $1826.
Correct Answer:
Verified
Q115: Figure 8-6 Q116: Figure 8-6 Q120: To maximise profit, a monopolist will produce Q123: In the short run, even if a Q133: The demand curve for a monopoly firm Q137: If a monopolist's price is $50 at Q138: Which of the following statements is true? Q147: A monopolist's demand curve is the same Q152: Explain why the monopolist has no supply Q156: What is the difference between a monopoly's![]()
![]()
A)is
A)Monopolists
Unlock this Answer For Free Now!
View this answer and more for free by performing one of the following actions

Scan the QR code to install the App and get 2 free unlocks

Unlock quizzes for free by uploading documents