Multiple Choice
Figure 8-9 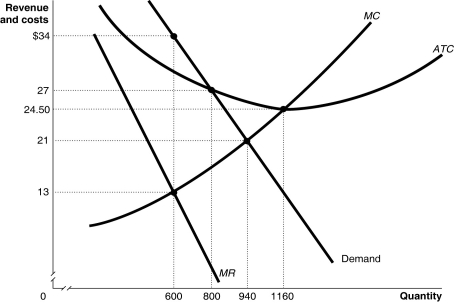 Figure 8-9 shows the demand and cost curves for a monopolist.
-Refer to Figure 8-9.What is the difference between the monopoly output and the perfectly competitive output?
A) 140 units
B) 240 units
C) 340 units
D) 560 units
Correct Answer:
Verified
Related Questions
Q124: Economic efficiency in a free market occurs
Q125: Explain whether a monopoly that maximises profit
Q132: Why does a monopoly cause a deadweight

