Figure 8-16 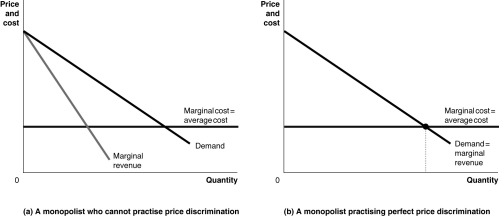
-Refer to Figure 8-16.Graph (a)represents a monopolist who cannot price discriminate and graph (b)represents a monopolist practising perfect price discrimination.On each graph,identify the monopoly price,the monopoly output,the efficient output,and the areas representing profit,consumer surplus,and deadweight loss.
Correct Answer:
Verified
View Answer
Unlock this answer now
Get Access to more Verified Answers free of charge
Q143: A firm that engages in price discrimination
Q148: A successful strategy of price discrimination requires
Q166: The airline industry routinely engages in price
Q171: Suppose a restaurant is trying to determine
Q172: What three conditions must hold for a
Q244: Consumers who will pay high prices to
Unlock this Answer For Free Now!
View this answer and more for free by performing one of the following actions

Scan the QR code to install the App and get 2 free unlocks

Unlock quizzes for free by uploading documents