Figure 4-8 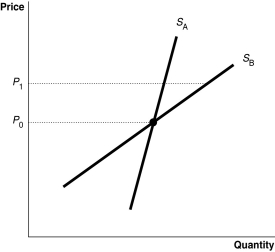
-Refer to Figure 4-8.The diagram shows two supply curves,SA and SB.As price rises from P0 to P1,which supply curve is more elastic?
A) SA
B) SB
C) They are equally inelastic.
D) They are equally elastic.
Correct Answer:
Verified
Q206: To calculate the price elasticity of supply
Q219: The process involved in bringing oil to
Q261: Suppose the demand curve for a product
Q271: Suppose when the price of jean-jackets increased
Q275: If a supply curve is a horizontal
Q277: The price elasticity of supply measures
A)the responsiveness
Q283: The price elasticity of supply is calculated
Q286: Which of the following statements is true?
A)The
Q288: Shifts in the supply of oil have
Q290: Suppose the demand curve for hybrid cars
Unlock this Answer For Free Now!
View this answer and more for free by performing one of the following actions

Scan the QR code to install the App and get 2 free unlocks

Unlock quizzes for free by uploading documents