Figure 3-8 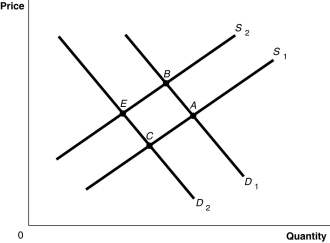
-Refer to Figure 3-8.The graph in this figure illustrates an initial competitive equilibrium in the market for sugar at the intersection of D1 and S1 (point A) If there is an increase in the price of fertiliser used on sugar cane and there is a decrease in tastes for sugar-sweetened soft drinks, how will the equilibrium point change?
A) The equilibrium point will move from A to B.
B) The equilibrium point will move from A to C.
C) There will be no change in the equilibrium point.
D) The equilibrium point will move from A to E.
Correct Answer:
Verified
Q162: Figure 3-8 Q167: Assume that the demand curve for MP3 Q169: Assume that the demand curve for MP3 Q169: Figure 3-8 Q170: Which of the following would cause a Q174: Draw a supply and demand graph showing Q192: Positive technological change in the production of Q196: Assume that both the demand curve and Q217: A decrease in the equilibrium price for Q374: Figure 3-8 Unlock this Answer For Free Now! View this answer and more for free by performing one of the following actions Scan the QR code to install the App and get 2 free unlocks Unlock quizzes for free by uploading documents![]()
![]()
![]()

