Figure 2-2 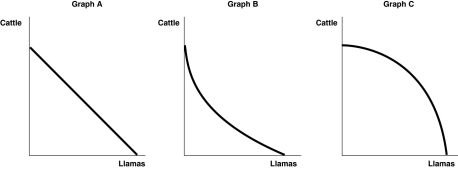
-Refer to Figure 2-2.Steve Vignetto raises cattle and llamas on his land.His land is equally suitable for raising either animal.Which of the graphs in Figure 2-2 represents his production possibility frontier?
A) Graph A
B) Graph B
C) Graph C
D) Either Graph B or Graph C
Correct Answer:
Verified
Q5: The production possibility frontier shows the _
Q8: The attainable production points on a production
Q8: Peter can produce either a combination of
Q15: Scarcity
A)stems from the incompatibility between limited resources
Q17: The production possibility frontier model shows that
A)
Q19: In a production possibility frontier model, a
Q23: _ marginal opportunity cost implies that the
Q23:
-Refer to Table 2-2. Assume Billie's Bedroom
Q27:
-Refer to Table 2-1. Assume Tomaso's Trattoria
Q35: Figure 2.2 ![]()
Unlock this Answer For Free Now!
View this answer and more for free by performing one of the following actions

Scan the QR code to install the App and get 2 free unlocks

Unlock quizzes for free by uploading documents