Multiple Choice
Figure 2.3 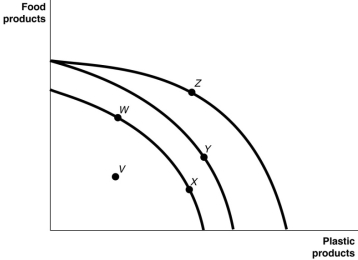 Figure 2.3 shows various points on three different production possibility frontiers for a nation.
-Refer to Figure 2.3.Consider the following movements:
a.from point V to point W
b.from point W to point Y
c.from point Y to point Z
Which of the movements listed above represents economic growth?
A) a, b, and c
B) b and c only
C) a only
D) b only
Correct Answer:
Verified
Related Questions

