Figure 6-6 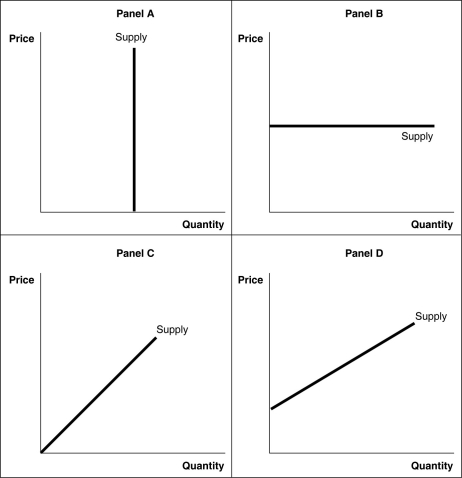
-Refer to Figure 6-6.The supply curve on which price elasticity changes at every point is shown in
A) Panel A.
B) Panel B.
C) Panel C.
D) Panel D.
Correct Answer:
Verified
Q80: Suppose the price elasticity of demand for
Q130: Figure 6-7 Q133: Figure 6-6 Q227: The demand for most farm products is Q241: Suppose the value of the price elasticity Q242: Price elasticity of supply is used to Q244: The price elasticity of the supply of Q251: The price elasticity of supply is equal Q257: Suppose a 4 percent increase in price Q259: Suppose that the price of a money![]()
![]()
Unlock this Answer For Free Now!
View this answer and more for free by performing one of the following actions

Scan the QR code to install the App and get 2 free unlocks

Unlock quizzes for free by uploading documents