Figure 5-7 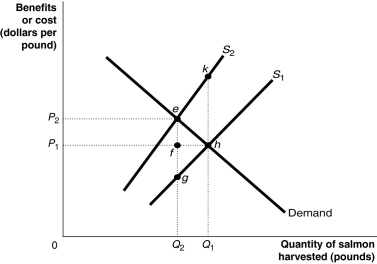
Figure 5-7 shows the market for Atlantic salmon, a common resource. The current market equilibrium output of Q1 is not the economically efficient output. The economically efficient output is Q2.
-Refer to Figure 5-7.Identify the area that shows the deadweight loss from overfishing.
A) egh
B) ekh
C) efh
D) eghk
Correct Answer:
Verified
Q125: Figure 5-7 Q206: Which of the following is an example Q208: The demand curve for a public good Q210: In economics, the term "free rider" refers Q212: The market demand for a public good Q216: How does the construction of a market Q225: Global warming refers to the effect of Q236: Overuse of a common resource may be Q243: "When it comes to public goods, individuals Q252: A quasi-public good differs from a public![]()
Unlock this Answer For Free Now!
View this answer and more for free by performing one of the following actions

Scan the QR code to install the App and get 2 free unlocks

Unlock quizzes for free by uploading documents