Multiple Choice
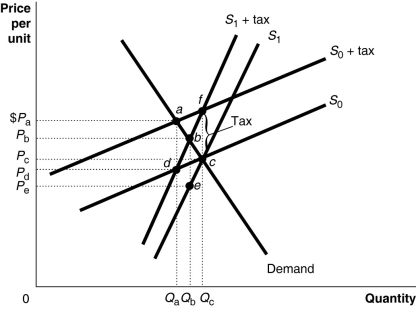 Figure 18-2 shows a demand curve and two sets of supply curves,one set more elastic than the other.
-Refer to Figure 18-2.If the government imposes an excise tax of $1.00 on every unit sold,the government's revenue from the tax is represented by the area
A) (PaPc × Qa) if the supply curve is S0 and (PbPc × Qb) if the supply curve is S1.
B) (PaPd × Qa) if the supply curve is S0 and (PbPe × Qb) if the supply curve is S1.
C) (PaPe × Qa) under either supply curve.
D) (PbPe × Qb) under either supply curve.
Correct Answer:
Verified
Related Questions

