Figure 18-6 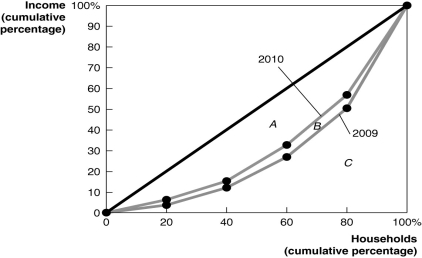
-Refer to Figure 18-6 to answer the following questions.
a.Did the distribution of income become more equal in 2010 that it was in 2009,or did it become less equal? Explain.
b.If area A = 1,600,area B = 200,and area C = 3,200,calculate the Gini coefficient for 2009 and the Gini coefficient for 2010.
Correct Answer:
Verified
View Answer
Unlock this answer now
Get Access to more Verified Answers free of charge
Q125: Table 18-6 Q127: Absolute poverty measures vary from country to Q130: Figure 18-5 Q133: The Center for Science in the Public Q134: A government-imposed tax on soft drinks would Q221: In the United States Q224: Which of the following tax systems would Q241: Rapid economic growth tends to increase the Q253: If the Gini coefficient for Cartland is Q254: Compare the distribution of income in the
![]()
![]()
A)the income tax system
Unlock this Answer For Free Now!
View this answer and more for free by performing one of the following actions

Scan the QR code to install the App and get 2 free unlocks

Unlock quizzes for free by uploading documents