Figure 16-3 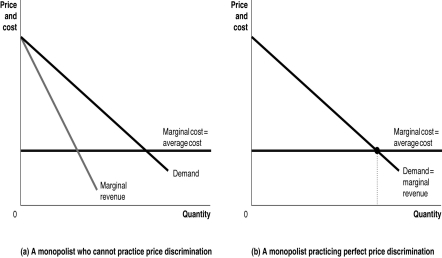
-Refer to Figure 16-3.Graph (a)represents a monopolist who cannot price discriminate and graph (b)represents a monopolist practicing perfect price discrimination.On each graph,identify the monopoly price,the monopoly output,the efficient output,and the areas representing profit,consumer surplus,and deadweight loss.
Correct Answer:
Verified
View Answer
Unlock this answer now
Get Access to more Verified Answers free of charge
Q99: With perfect price discrimination, the marginal revenue
Q165: Book publishers often use price discrimination across
Q172: What three conditions must hold for a
Q174: Arnold's Airport Transport provides passenger transportation to
Q175: One method of setting price using the
Q177: What is the difference between price discrimination
Q182: All of the following are disadvantages of
Q197: Which of the following is not an
Q197: Most supermarkets charge the same price for
Q198: If demand is taken into account, firms
Unlock this Answer For Free Now!
View this answer and more for free by performing one of the following actions

Scan the QR code to install the App and get 2 free unlocks

Unlock quizzes for free by uploading documents