Figure 15-1 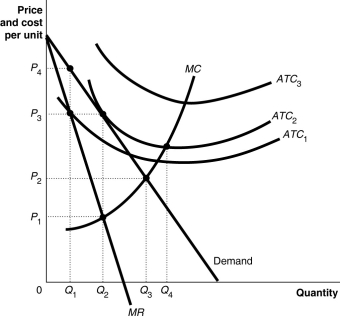 Figure 15-1 above shows the demand and cost curves facing a monopolist.
-Refer to Figure 15-1.To maximize profit,the firm will produce
A) Q1.
B) Q2.
C) Q3.
D) Q4.
Correct Answer:
Verified
Q51: Figure 15-1 Q66: For a natural monopoly, the marginal cost Q80: Most pharmaceutical firms selling prescription drugs continue Q82: Provide two examples of a government barrier Q83: Microsoft hires marketing and sales specialists to Q88: If a monopolist's price is $50 per Q89: Because a monopoly's demand curve is the Q96: The demand curve for the monopoly's product Q98: If a monopolist's marginal revenue is $25 Q99: What gives rise to a natural monopoly?![]()
Unlock this Answer For Free Now!
View this answer and more for free by performing one of the following actions

Scan the QR code to install the App and get 2 free unlocks

Unlock quizzes for free by uploading documents