Multiple Choice
Figure 15-9 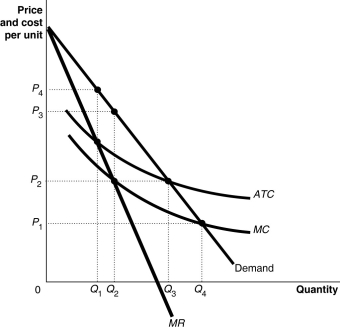
Figure 15-9 shows the cost and demand curves for the Erickson Power Company.
-Refer to Figure 15-9.The profit-maximizing price is
A) P1.
B) P2.
C) P3.
D) P4.
Correct Answer:
Verified
Related Questions
Q121: The government estimated that by allowing the
Q123: Figure 15-7 Q127: Figure 15-9 Q164: Firms do not have market power in Q207: The Sherman Act prohibited Unlock this Answer For Free Now! View this answer and more for free by performing one of the following actions Scan the QR code to install the App and get 2 free unlocks Unlock quizzes for free by uploading documents![]()
![]()
A)marginal cost pricing.
B)setting price

