Figure 13-3 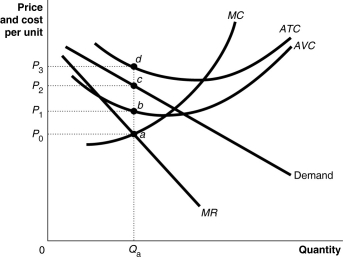
Figure 13-3 shows short-run cost and demand curves for a monopolistically competitive firm in the market for designer watches.
-Refer to Figure 13-3.What is the area that represents the total fixed cost of production?
A) 0P1aQa
B) P0adP3
C) P1bdP3
D) That information cannot be determined from the graph.
Correct Answer:
Verified
Q29: Table 13-1 Q32: Figure 13-3 Q38: Which of the following statements is true Q41: What are the most important differences between Q54: Explain the differences between total revenue, average Q59: In monopolistic competition, if a firm produces Q61: Table 13-2 Q62: Table 13-2 Q63: What is the profit-maximizing rule for a Q77: Table 13-2 Unlock this Answer For Free Now! View this answer and more for free by performing one of the following actions Scan the QR code to install the App and get 2 free unlocks Unlock quizzes for free by uploading documents
![]()
![]()
![]()
![]()
![]()

